By Charlie Nelson and Deanna Ramsay, originally published at CIFOR’s Forests News
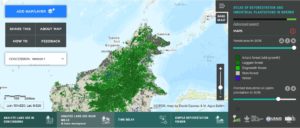
When a tree falls in Borneo, does it make a sound? A new interactive atlas developed by the Center for International Forestry Research (CIFOR) is making sure it does.
Incorporating 40 years of maps of Borneo (the world’s third largest island), the tool reveals both the forest remaining and what is being reshaped due to degradation and extraction industries. With the ability to search by oil palm or pulpwood concessions, and view the locations of intact peatland, as well as determine the speed with which forest is converted to plantation, the atlas offers the first significant opportunity to distinguish companies that are avoiding deforestation to a large degree.
CIFOR scientist David Gaveau, who developed the atlas, said, “The tool is an open platform for researchers, advocacy groups, journalists and anyone interested in deforestation, wildlife habitats and corporate actions.”
The data provided by the atlas is free to download, and informs whether a particular oil palm concession is certified by the Roundtable on Sustainable Palm Oil (RSPO)- the organization that implements a global standard for sustainability in the palm oil industry.
In addition to providing data on deforestation and land use for individual land concessions, the tool allows users to search by company, as companies often own multiple concessions.
One can also filter information by country, province and peat area remaining, which allows users to get the big picture of corporate land use on the island shared by Malaysia, Indonesia and Brunei.
Map developer Mohammad Agus Salim said of the feature, “Large companies with sustainability commitments, such as zero deforestation pledges, may not have complete information at their disposal about their individual concessions. The baseline deforestation we present in this atlas allows them to track those pledges.”
In Indonesia, for example, where oil palm covers approximately 10.5 million hectares of land, companies have vowed to halt deforestation and the draining of peat swamps, thereby certifying their products as not having contributed to the destruction of forests or increased greenhouse gas emissions.
Beyond the transparency of attributions to direct deforestation, there are plans for the tool to reveal additional cogs in the supply chain wheel.
“We plan to add the location of mills and refineries where palm oil bunches are brought from plantations to be processed,” Salim said, thereby allowing one to track the relationship between mills and concessions. “Our aim is to trace palm oil and pulpwood from production to consumption.”
But the tool’s collation of Landsat-based maps, which offer striking visibility, also present a larger story of deforestation and its processes.
According to Matt Hansen of the University of Maryland, an expert in the use of satellites to monitor deforestation, “At 30 meters we see more of the change and the human footprint. We can get a clear picture of our appropriation of natural environments.”
Allowing one to see how humans have reshaped Borneo is essential amid competing demands for cheap oil and conserved forest.
Hosting about eight million hectares of industrial oil palm plantations – about half of the estimated global planted area of 18 million hectares – Borneo is the world’s second-largest center of palm oil production. Indonesia and Malaysia are the world’s number one and two producers of palm oil, together amounting to 85 percent of global production.
But Salim notes that the map shows more that just the impacts of plantations. Zooming into a section splashed with blue amid the green of intact forest, he pointed out two hydro-power dams that have caused serious forest loss in Malaysian Borneo.
Historical data
The result of a four-year effort, the tool was launched at the Global Landscapes Forum in Marrakesh late last year, on the sidelines of COP22.
With aggregated maps dating back to 1973, the atlas allows users to see the extent of forest area from an earlier time before extraction industries began making inroads on the island.
Gaveau said, “The key is the 42 years of data. No other studies look at Borneo over such an extensive period of time. We are the first.”
The long timespan allows for in-depth analysis, including the monitoring of the draining of peatlands, and there are plans to include the ownership history of concessions, as land titles have significantly changed hands over the years.
“Not all the deforestation in a concession is due to companies. The time delay analysis information enables certain attribution, and for us to ask whether deforestation is caused by a company or not, and when,” said Gaveau.
Looking at landscapes
And while the intricacies of land rights and boundaries remain discussed and debated, this tool created from satellites orbiting far overhead allow users to see the ground-level issues.
At the Global Landscapes Forum, where he participated in the launch of the atlas, Hansen said, “Even with satellites, you don’t look at a single pixel – that would make no sense. You wouldn’t even look at a forest patch. You need to back up. It only makes sense when you look at it on a landscape scale.”
And it is the landscape scale that reflects the map’s usefulness across sectors, terrain and time.
“At the landscape scale, all these parties are interested, so you have a nice multi-stakeholder framework. It makes a lot of sense,” Hansen said.
With plans to expand to Sumatra, Papua and peninsular Malaysia, the tracking of land use and land-use change over the decades will incorporate even more stakeholders, so that the sound of trees falling doesn’t fall on deaf ears.

